 Operational KPIs Take Emotion Out of the Equation
In Part 1 of our Executive Dashboard series we introduced the Club Benchmarking Executive Dashboard and the section related to Operating Finance KPIs. In Part 2 of the series we explored the “Capital Generation” section of the Executive Dashboard which is comprised of three Key Performance Indicators that correlate directly to a club’s future: Total Available Capital, Net Available Capital and the ratio of Available Capital to Operating Revenue.
The Key Performance Indicators related to club operations in the third section of the Executive Dashboard address two essential aspects of the delicate balance between member expectations and a club’s financial realities. Undertaking a fact-based assessment of these two extremely sensitive issues, club payroll and food and beverage (F&B) results, can turn emotional boardroom debates into focused business discussions.
Key Question #1
Are we staffed at a level that balances financial results and member service expectations?
KPI: Payroll Ratio
Calculation: Payroll to Operating Revenue Ratio = Total Payroll (including total payroll taxes and benefits)/Operating Revenue
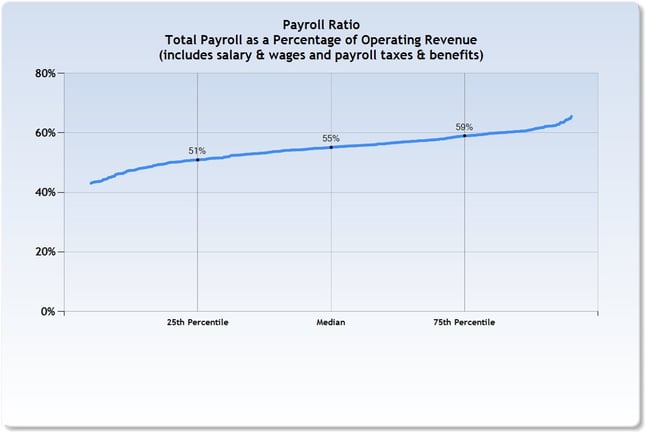
Why it Matters: The Payroll Ratio is the club’s total loaded payroll divided by its operating revenue. This is one of the most important ratios for managers and boards to understand and measure. Ultimately, three critical parameters intersect in this ratio; financial results, operating efficiency and member satisfaction. There is a direct correlation between this ratio and the Gross Margin of every club. Clubs in the upper quartile (above the 75th percentile) tend to generate operating deficits (negative Gross Margin). Clubs in the lower quartile (below the 25th percentile) tend to generate an operating surplus. Clubs between the 25th and 75th percentile tend to hover around operating break-even (zero Net Operating Result). The ratio is statistically "tight,” meaning the farther you fall from the median, the more drastic the differentiating performance of Net Operating Result. As with most indicators, there is no firm right or wrong and this ratio should be looked at in concert with Net Operating Result. For instance, if Net Operating Result is negative and your Payroll Ratio is significantly above the median, reduction of payroll likely needs to be considered (see other Club Benchmarking reports and metrics to diagnose department level labor expenses). On the other hand, if you happen to have a relatively high Payroll Ratio and positive Net Operating Result, it is likely indicative of a higher Gross Profit to Revenue ratio (higher gross margin) which is likely a sustainable model. The chart below shows that in fiscal year 2014, median Payroll Ratio was 55 percent for all clubs in the database.
Key Question #2
What is the financial impact of F&B on the club?
KPI: Net F&B to Gross Profit Ratio
Calculation: Net F&B to Gross Profit Ratio = (F&B Profit or Loss/Gross Profit)
NOTE: This calculation requires F&B department revenue and expenses in alignment with Club Benchmarking standardization of F&B accounts.
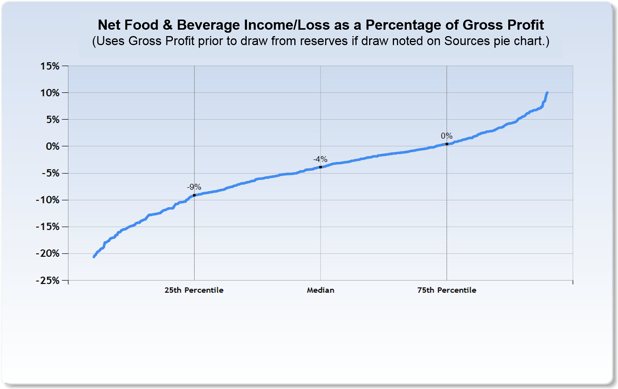
Why it Matters: Across the industry, context is often missing in discussions about financial results from F&B. Focusing on straight F&B revenue drives far too many board meetings off course. As a Key Performance Indicator, the ratio of Net F&B to Gross Profit provides a crystal clear view of F&B in the financial context of the overall club by identifying the relative impact of F&B as opposed to simply the result in absolute dollars. To illustrate, consider this: Two clubs might have the exact same dollar loss in F&B, but that same amount may be insignificant to one club while highly impactful to the other. Context is key. If the ratio is -15 percent and your club has an operating deficit as evidenced by negative Net Operating Result, the F&B loss may need to be trimmed. The same -15 percent ratio in a club with an operating surplus as evidenced by positive Net Operating Result may indicate that the subsidy is acceptable and reflective of what are essentially cultural choices the club has made in terms of service expectations and food quality. As a side note, making a substantive impact in F&B results will typically require an adjustment in the F&B labor to revenue ratio. The chart below shows that for fiscal year 2014, about 80 percent of clubs had a negative Net F&B to Gross Profit ratio, meaning they subsidized F&B to some degree. At the median, the ratio was -4 percent.
Did you miss the webinar? Watch it in our video library.
.png?width=200&height=58&name=MicrosoftTeams-image%20(8).png)


.png)
-1.png)
-1.png)

