
Compensation & Workforce Benchmarking
Private club compensation benchmarking, from the general manager to the dish steward
Pay your people fairly, budget payroll with confidence and give your Board a defensible answer. Club Benchmarking benchmarks compensation and benefits for more than 150 club positions, with three ways to put it to work: a Navigator Prime subscription, the new Workforce Profile, and an Executive Compensation Study for your Board.
Three ways to benchmark compensation
Put every compensation decision in market context
Whether you are making an offer to a line cook, setting the annual wage increase pool or reviewing your general manager’s contract, the question is the same: what does the market pay for this role at a club like ours? Pick the level of insight that fits the decision.
Benchmarks for 150+ positions
Self-serve compensation and benefits benchmarks for hourly and salaried roles, by position or by department, available 24/7 in VISTA.
The Workforce Profile
Your club’s turnover, tenure, overtime and staffing mix benchmarked against peers, built from the Payroll Report you submit.
Executive Compensation Study
A Board-ready report that benchmarks your general manager and executive team line by line, against peer sets the Board approves.
Why our compensation data
The private club industry’s largest compensation database
Clubs submit through a structured compensation and benefits worksheet or directly from payroll, so the figures reflect what clubs actually paid, not what someone recalled on a survey. Every comparison shows the number of clubs and respondents behind it, and no individual club’s compensation is ever disclosed.
Navigator Prime
Compensation and benefits benchmarks for 150+ positions
Prime is the Navigator plan built for clubs that benchmark the whole team, not just the top executives. From the front desk to the kitchen, see what peer clubs pay for the same role, by position or by department, and filter the comparison by size, location, amenity set and more.
150+ position benchmarks
Hourly and salaried positions across every department of the club, benchmarked by position or by department against the peer set you choose. Look up a single role before an offer, or review an entire department before budget season.
Health insurance and retirement plans
Health insurance plan and retirement plan benchmarks show how your benefits package compares, so the club measures total rewards, not just wages.
Staffing & Compensation dashboards
Dynamic dashboards and the Labor Report put payroll and staffing in context alongside the club’s finances and operations, so labor cost is never read in isolation.
Transparent comparisons
Every comparison shows how many clubs and total respondents are in the set, so you know the strength of each number before you take it to a committee.
COMING SOONNew in Summit
The Workforce Profile: your club’s people data, side by side with your peers
Workforce data is more than an HR metric. It drives compensation planning, workforce stability, recruiting success and long-term financial performance. The Workforce Profile, a new addition to the Compensation & Benefits section of the platform, shows where your club stands and where to act.
Once your club submits its Payroll Report, these metrics are ready whenever you need them. No more pulling numbers together by hand, so you and your team can spend that time acting on them.
Executive Summary
Your most important workforce metrics at a glance.
Workforce Composition
How your staff is built and distributed across the club.
Tenure
Broken out by year-round full-time, year-round part-time and seasonal staff, so you can see the differences between them.
Retention Signals
How your workforce is turning over and where the ages of your staff currently lie.
Benchmarked KPIs include
Turnover rate less seasonal staff · Overtime as a percent of hours · Full Member Equivalents (FME) per Full Time Equivalent employee (FTE) · New hires retained six months or more · Total labor cost, turnover and overtime by department
Compare your way
Every KPI and graphic is measured against a peer set. Start with all clubs with Payroll Report data, then refine by geography, peer cluster, club type, total revenue and more. Toggle year-over-year change and switch between hourly and salaried staff.
Executive Compensation Study
Executive compensation your Board can defend to the membership
Compensation agreements are between the club and the staff member, not between a single Board and the staff member. An Executive Compensation Study gives the club a documented, data-based foundation that carries from one Board to the next. It benchmarks the Head of Club (General Manager, COO or CEO) and any other executive positions you choose, line item by line item, against peer sets built with your club. Choose the level of depth that fits the decision in front of you.
Executive Compensation Report
Your executive compensation benchmarks, built by our analysts into a complete report. Custom peer sets, line-item tables for every position with percentile rankings, and written analysis of where the club stands. Ideal for clubs that don’t subscribe to Navigator, or that would rather receive a finished report than run the benchmarks themselves.
Advanced Compensation Study
Everything in the Executive Compensation Report, plus distribution graphics that plot your club against the full market and your peers, five scale and affordability measures that test whether each package fits the role’s scope, a narrative executive summary written for the Board, and a presentation of the findings to your Board.
Which option fits
Choose the right level of compensation insight
Many clubs use more than one: Prime for everyday hiring and budgeting, the Workforce Profile to track stability and retention, and an Executive Compensation Study when the Board reviews the leadership team.
| Navigator Prime | Workforce Profile | Executive Compensation Study | |
|---|---|---|---|
| Answers | What do peer clubs pay for this role? | How stable and efficient is our workforce compared to peers? | Is our executive compensation appropriate for our scale, and what is our policy? |
| Covers | 150+ hourly and salaried positions, plus health insurance and retirement plans | Turnover, tenure, overtime, staffing mix and labor cost by department | Head of Club plus any executive positions you choose, line item by line item |
| Best for | Club managers, HR and finance leaders | Club managers, HR directors and department heads | Boards, Presidents and compensation committees |
| Format | Self-serve benchmarks and dashboards in VISTA, 24/7 | Interactive KPIs and graphics in VISTA | Executive Compensation Report, or the Advanced Compensation Study with distribution graphics and a Board presentation |
| How to get it | Navigator Prime or Summit plan | Included with Summit (coming soon) | Scoped engagement |
Solutions by role: Club managers · CFOs & controllers · Boards of directors · Owners & management companies
Compensation research
What the data says about club compensation
Club Benchmarking publishes the research behind its compensation methodology, so you can read the findings before you act on them. Free in the Resource Center.

Executive Compensation in Private Clubs
What drives total compensation for executive team positions. Club and department size are the most consistent predictors; cost of living contributes only marginally.
Read the whitepaper

Executive Compensation in the Club Industry
Tests one of the industry’s most firmly held beliefs, that GM pay is driven by location, and shows why scale matters more.
Read the whitepaper
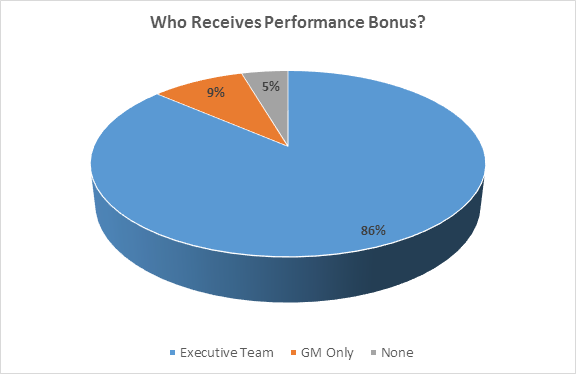
GM and Executive Staff Bonus Plans
How executive bonus plans are structured in the private club industry and what drives them.
Read the whitepaper
Evolution of the Head of Finance Role in Clubs
How the club CFO and controller role has grown in scope and influence on the leadership team.
Read the whitepaper
Common questions
Private club compensation, explained
How much should a private club pay its general manager?
It depends most on the size and complexity of the operation. Club Benchmarking’s research shows operating revenue explains more than 70% of the variation in Head of Club total compensation, so a credible benchmark compares your club to clubs of similar scale rather than simply matching titles or locations.
Does location drive executive pay at clubs?
Less than most Boards assume. Our published whitepapers find that executive compensation aligns with national market forces, and that cost of living contributes only marginally once club size is taken into account.
Which positions can my club benchmark?
Navigator Prime and Summit include compensation and benefits benchmarks for more than 150 hourly and salaried positions, by position or by department. The Essentials plan covers top executives.
Is our club’s compensation data kept confidential?
Yes. Benchmarks are reported as aggregates of the peer group, such as percentiles and medians, with the number of clubs reporting. No individual club’s compensation is ever disclosed.
What is the Workforce Profile and when is it available?
The Workforce Profile benchmarks turnover, tenure, overtime and staffing composition against peer clubs. It is coming soon to the Compensation & Benefits section of the platform for Summit subscribers, built from each club’s Payroll Report.
Does an Executive Compensation Study set pay?
No. Both the Executive Compensation Report and the Advanced Compensation Study quantify market value and state a clear conclusion, but the decision stays with the Board. The Advanced Compensation Study goes a step further and recommends that the Board adopt and document a compensation philosophy with a target percentile range.
Fact over opinion on compensation
Know what the market pays before you decide
Tell us what decision is in front of you, an open role, a payroll budget or a contract review, and we’ll show you the right way to benchmark it.
Book a meeting with our team See plans & pricing