.png?width=200&height=58&name=MicrosoftTeams-image%20(8).png "Club Benchmarking Logo png")
Club Benchmarking uses quartiles and percentiles rather than averages to prevent statistical anomalies from interfering with our ability to present an accurate picture of industry norms and your club's own performance. Here's a quick refresher on what those terms mean:
Example of metric icons found in the "Compare Clubs" section
of the Club Benchmarking platform
Percentile Line with Your Club between the 25th and 75th percentiles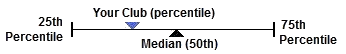
Percentile Line with Your Club less than the 25th percentile, in the first quartile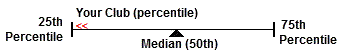
25th Percentile - Also known as the first, or lower, quartile. The 25th percentile is the value at which 25% of the answers lie below that value, and 75% of the answers lie above that value.
50th Percentile - Also known as the Median. The median cuts the data set in half. Half of the answers lie below the median and half lie above the median.
75th Percentile - Also known as the third, or upper, quartile. The 75th percentile is the value at which 25% of the answers lie above that value and 75% of the answers lie below that value. Above the 75th or below the 25th percentile - If your data falls above the 75th percentile or below the 25th percentile we still display your data and include a << or >> indicator noting that your club's position is above or below those points.