.png?width=200&height=58&name=MicrosoftTeams-image%20(8).png "Club Benchmarking Logo png")
 The most successful private club executives are in a class of their own when it comes hospitality. They are experts at delivering an extraordinary club experience and managing large teams of people, but we’ve only met a handful that would be comfortable calling themselves experts in accounting or finance. While that’s not surprising since the skillsets are so different, it does present a challenge.
In the club boardroom, even strong managers can find themselves at a disadvantage when they come face-to-face with business owners, hedge fund managers, CPAs, private equity managers—people who are extremely well-versed in finance and business. In that scenario an imbalance of power exists, due in large part to the vast difference between the way finance is discussed in the outside business world and the kind of discussions that take place inside the club boardroom.
It's a serious communication gap and it leaves many managers struggling to explain the club's results in a way that satisfies the board. The language of business is finance and it is certainly the native language of your board. Our goal is to help managers learn to speak the language of finance so they can feel more confident in the boardroom and communicate with their boards more effectively.
Business people, like those who populate club boardrooms, understand financial modeling and they know the key performance indicators for their own businesses. They know their gross margin; they understand their fixed expenses as a proportion of revenue; they understand return on equity. Business owners explain their business using numbers every single day. For private club managers, knowing the club’s numbers, putting them into context and presenting them with confidence is the key to getting the board’s full attention and advancing their understanding of the club business.
Let’s look at just one example of how numbers and context can be used to address questions and explain an important aspect of the club business:
Explaining Club Payroll: Focus on Data and Context
- “What are all these people doing here?”
- “We have way too many people.”
- “Our payroll is way too high.”
Every manager has heard those statements. They’re uttered every day in clubs across the country, in the boardroom and by members in the 19th hole. Absent data and context, those statements amount to little more than conjecture and responses like “We need all of these people” or “We have a smaller staff than XYZ Club up the road” are equally unproductive and unsatisfying. Thus, the debate continues.
The question boards and managers should be asking (and answering) is this: “Are we staffed at a level that balances the club’s financial results and our member service expectations?” The first step in answering that question and introducing numbers and context to the great payroll debate is to calculate the club’s payroll ratio (total “loaded” payroll as a percentage of total operating revenue).
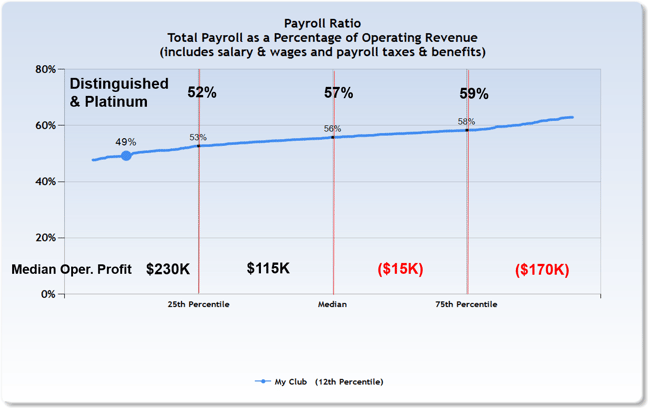
The chart below shows the Payroll Ratio for clubs with golf using club industry data for fiscal year 2015. As you can see, the median Payroll Ratio for this data set is 56 percent. For half the clubs in the set (those between the 25th percentile and the 75th percentile) the Payroll Ratio ranges from 53 percent to 58 percent. It's a small spread but as you can see from the overlay of median operating profit, the impact of a few points is significant.
The blue dot in the lower quartile (payroll ratio of 49%) represents a real club – one that was, until recently, stuck in the payroll debate. A small contingent of the membership was actively working to convince others that the club had “too many people” and that those people were being paid too much. Clearly, having the number (payroll ratio) and putting it in the context of hundreds of other clubs via a comparison set is powerful. What the chart confirms is that this club has a payroll ratio lower than 88 percent of the other clubs in this data set.
In the example above the number was well below the median, but some clubs may find that their Payroll Ratio is at or above the median. Whatever the case, it’s important to remember that the number itself is not a conclusion but rather a starting point and foundation for a fact-based discussion about financial realities, club culture and choices. As an example, adjusting a higher-than-typical Payroll Ratio back toward the median is ultimately a matter of choices. Are members happy with current service levels? Would they be open to a reduction in staffing levels or service hours? Is the financial impact of the Payroll Ratio such that the board must make difficult decisions regardless of the members’ preferences? Without numbers and context, the payroll debate is bound to continue as a contentious guessing game. Armed with numbers and context, managers are equipped to bridge the divide and discuss the club's business with the board in their native tongue—the language of finance.
WATCH THE VIDEO